Your sites side by side, this week against last
Charts, tables and maps for each site, built from 96 ready-made metrics or your own, with this period set against the last.
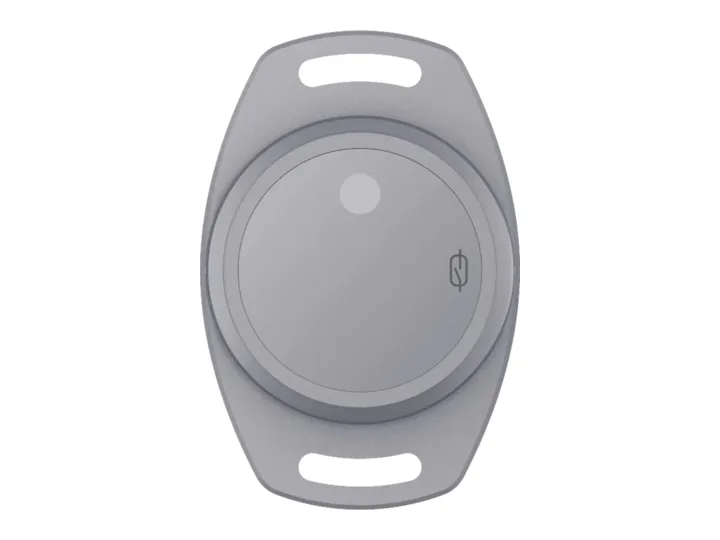
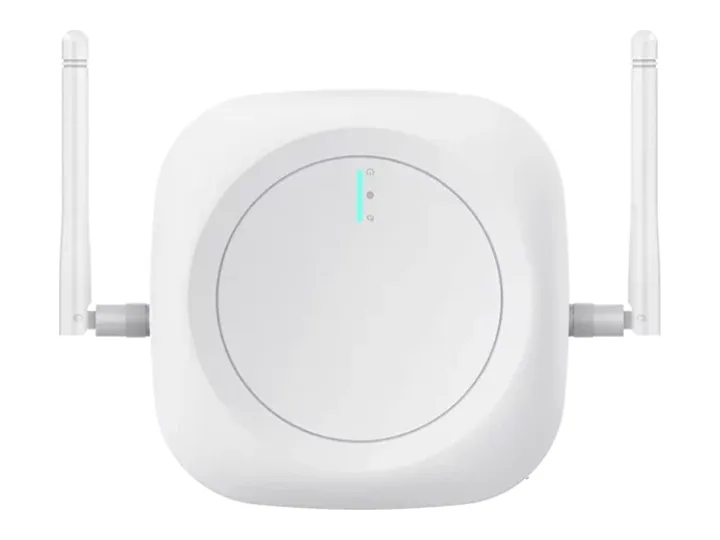
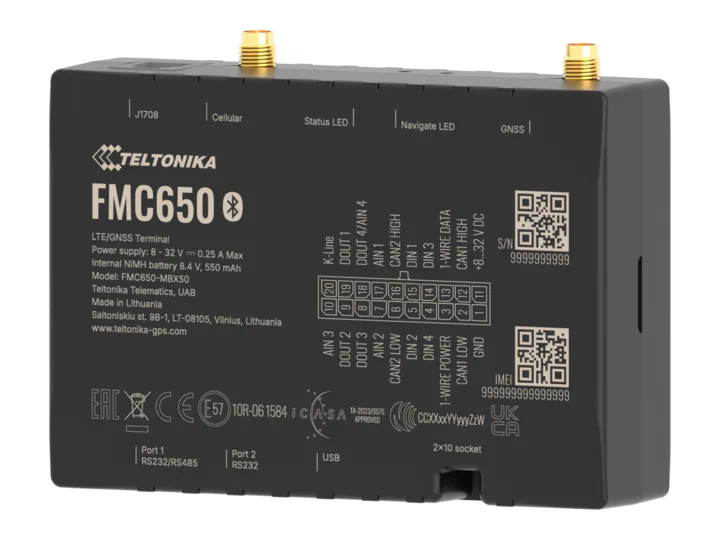
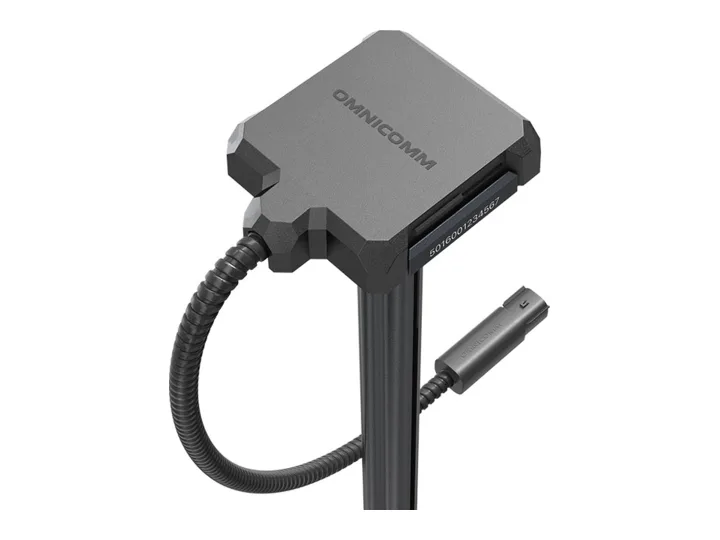
OnOneIoT devices+Partner devices
Used in:Climate control
Dashboards & twins
A dashboard for each team, built by drag and drop, KPIs from your own formulas, and a live view you can share by link. Reports go out by email on the schedule you set.
Used in:Climate control · Asset tracking · Edge control
What it does
Charts, tables and maps for each site, built from 96 ready-made metrics or your own, with this period set against the last.
OnOneIoT devices+Partner devices
Used in:Climate control
Write the formula once — stops, downtime, first-pass yield — and the KPI turns green, amber or red against your targets, for each site, area and machine. Running at Gloster Cables, with Elogictech Edge.
Used in:Edge control
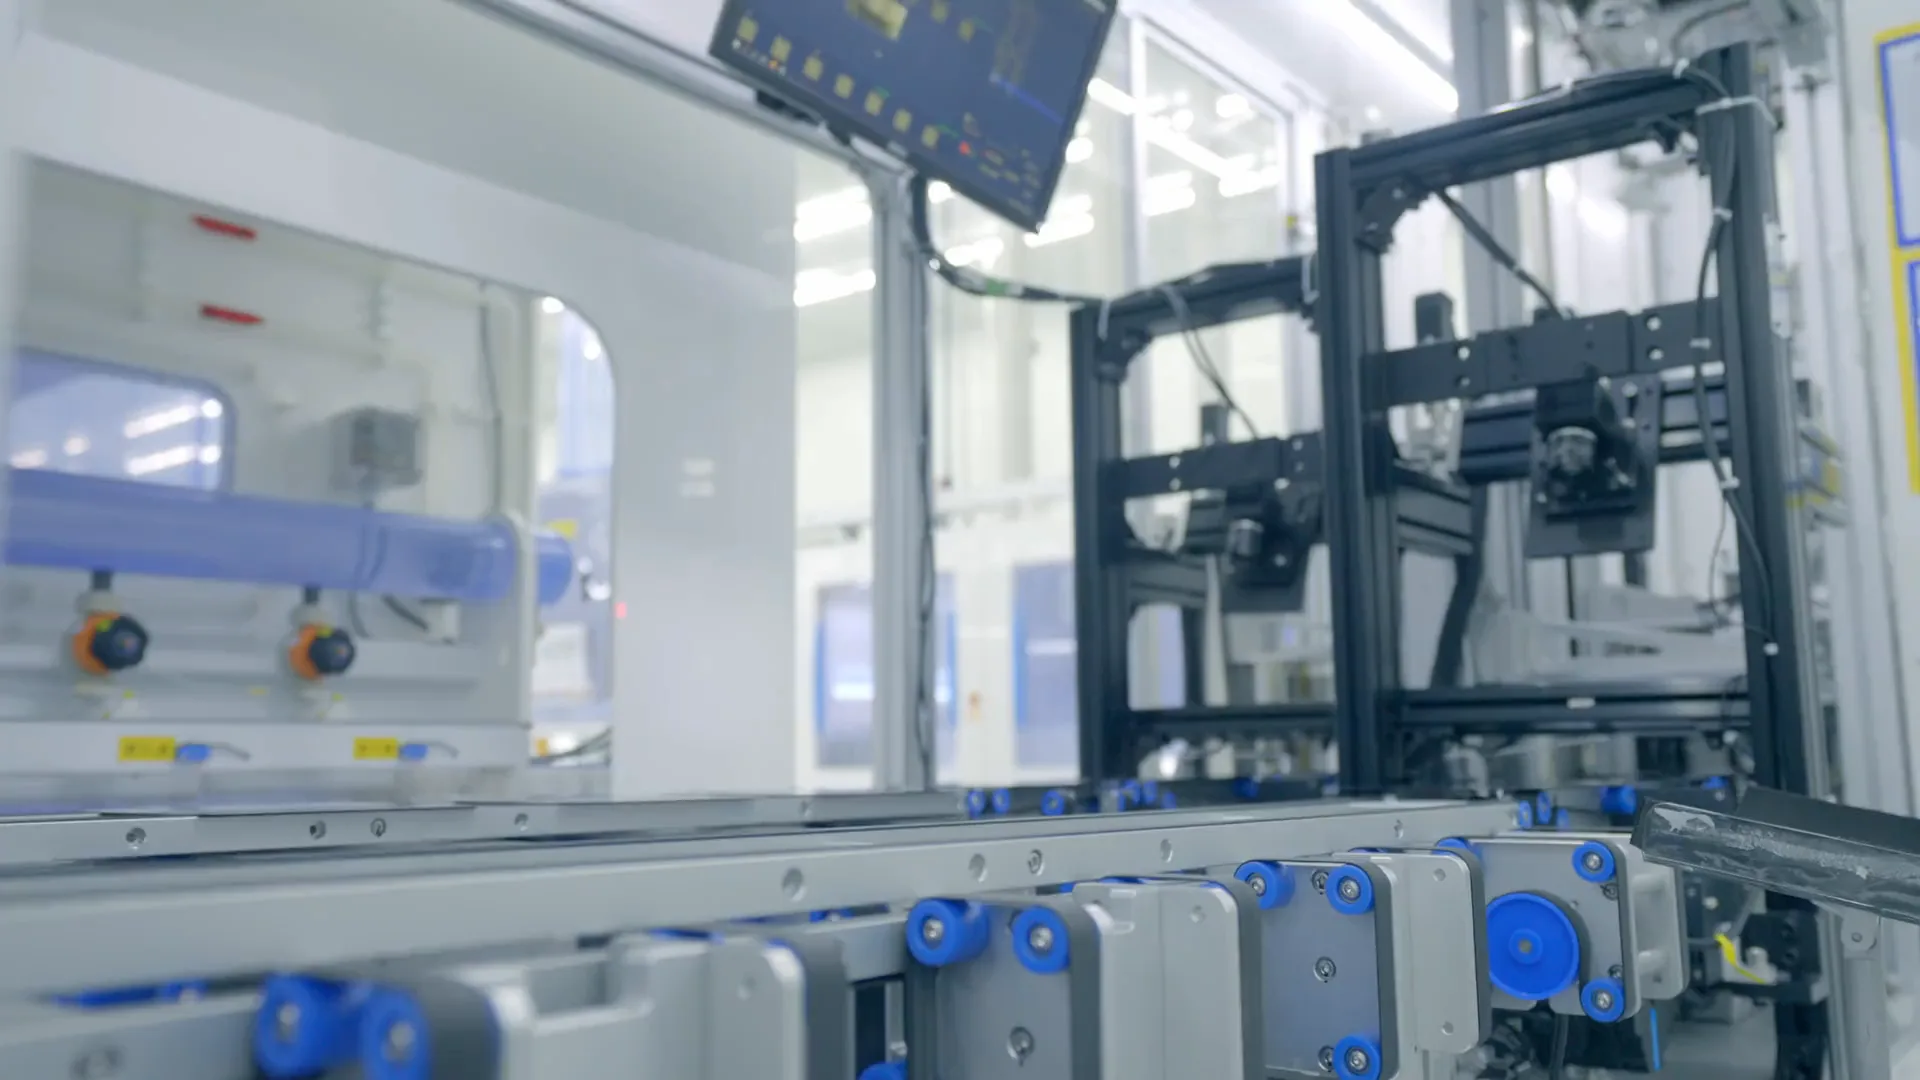
Stoppage reasons come straight from the line's HMI, so downtime, OEE, MTBF and MTTR add up by shift without anyone keying them in.
Used in:Edge control
Share a live dashboard by link — with a customer, an auditor or the night shift. Revoke the link, or set it to expire, when the job is done. Want them in for good? Give them their own login, under your brand.
Used in:Asset tracking · Climate control
Your brand on it: White label →Rooms, lines and machines as 2D and 3D twins, each part carrying its own readings, and video where there's a camera.
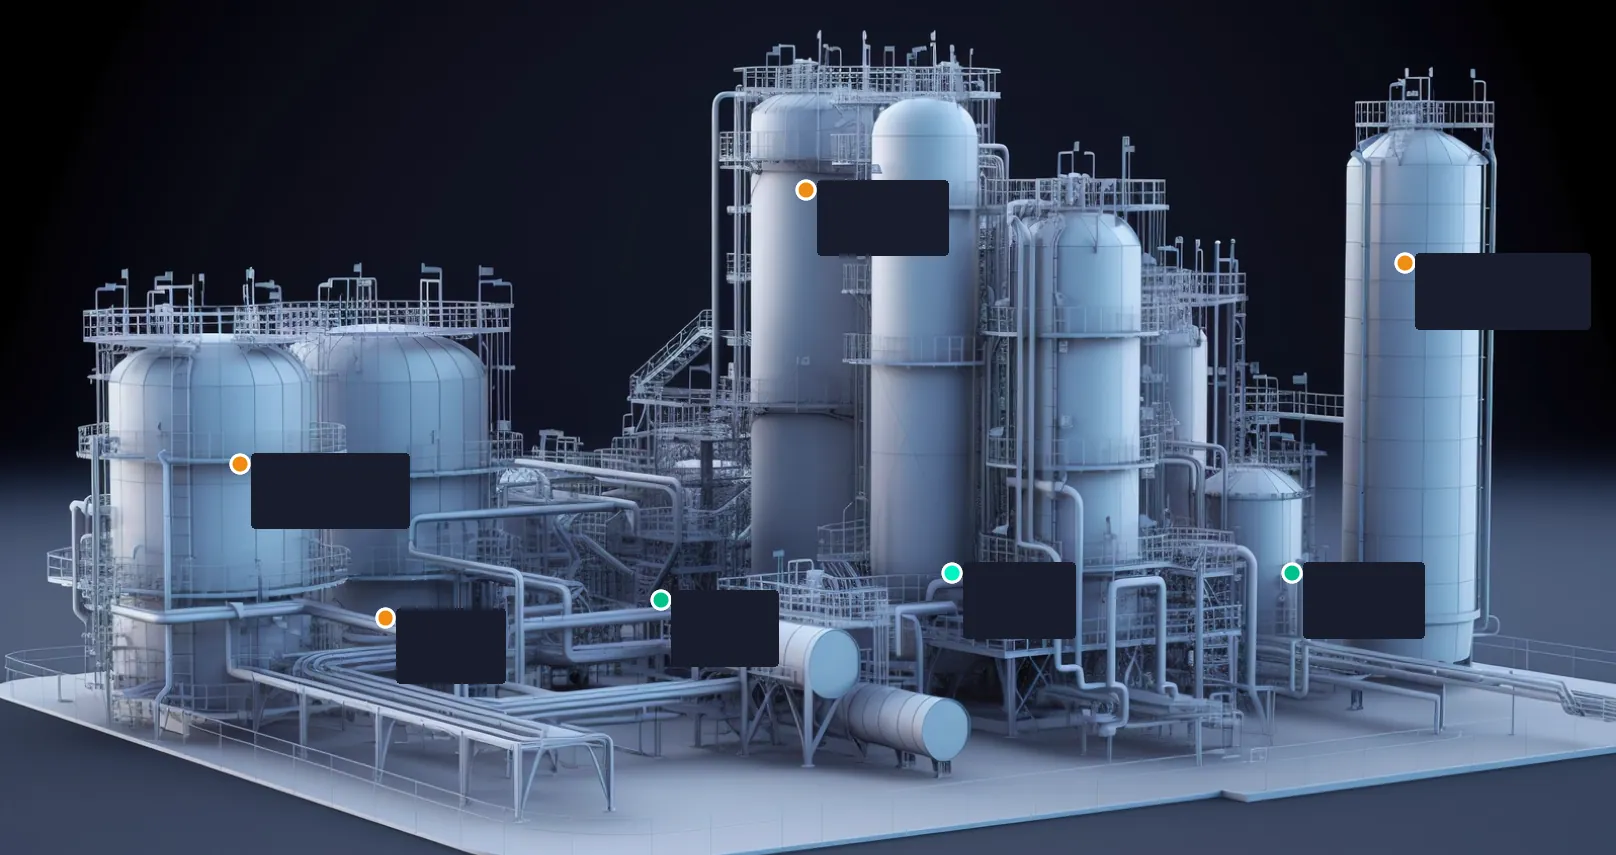
Process unit · last 30 minAbove limit for 15 min
Reports by site and period, exported as CSV or emailed on a schedule, with cold rooms rolled up to each facility. Any gap in the data is marked on the report.
Used in:Climate control
Generated by OneIoT · Sep 1, 6:00 AM · page 1 of 1
Next report · Oct 1 · by email
Devices
Where it runs
6processes on one line
Shift, line status and stoppage reasons from the HMI, turned into downtime and OEE by shift.
10,000+devices
Sells fleet dashboards under its own brand, on 10,000+ devices.
Questions
Something we haven't answered? Ask it on the call, or write to [email protected]
Also in OneIoT:Monitoring & tracking · Fleet & routes · Alerts & incidents · Rules & workflows · Edge control
Yes. Write the formula once and set green, amber and red bands per site, area or machine.
Yes. Reports export as CSV by site and period, or go out by email on a schedule.
Yes. Share a live view by link; no login needed. Revoke the link or set it to expire at any time.
Where to start
Call
Outline
Your sites
Results
Then a written rollout plan and a monthly price per site or per tracked device.
Making cold rooms, freezers or machines? Sell them connected, under your name